Suppose you spent one hundred thousand yen in a month. That hundred thousand produced fifty registrations, ten first purchases, and three parties still continuing six months later. The cost per unit is two thousand yen, and it is ten thousand yen, and it is roughly thirty-three thousand yen.
All three are correct calculations. There is no error in the division. Only the denominator differs: which stage you count as one turns the same spending into three figures.
Which one to use looks like a matter of taste. It is not. The figure you decide to use for judgement becomes, in that act, the object of optimisation. Try to bring the two thousand down and ease of registration gets maximised. An operation that maximises ease of registration is also an operation that increases parties with low involvement.
And the effect of that increase does not appear in that figure. Registrations rise, cost per unit falls, and the indicator stays improved. What appears, months later, is a different figure. The proportion reaching a transaction, and the proportion continuing. By the time those two fall, a season sits between them and the period when you improved upstream.
These three figures build entirely different operations depending on where in the judgement you place them. Run on the two thousand and your hand reaches toward bringing it down. Run on the thirty-three thousand and there is no way to bring it down, so your hand turns elsewhere. The same spending in the same month demands different behaviour according to where you look.
Below, three things get confirmed.
The first is that one has four stages, and that the higher the stage the easier it is to measure while the lower the stage the heavier its meaning. This order is not accidental; it comes out of how far apart things are in time. The four stages line up in order because a change in involvement sits behind the separation in time. That the changing point is what makes a stage is handled in what is arranged in the stages.
The second is the property that an indicator placed as a target cannot escape changing character, and the fact that the speed of that change differs by indicator. Searching for an indicator that does not change character comes up empty, but choosing one that changes slowly is meaningful work.
The third is what the phrase the place breaks concretely refers to. It is not a metaphor but the state in which a skew in composition reinforces itself. Since there is no moment of breakage, when the state was entered cannot be identified afterwards either.
This article cannot produce a value for one item: the upper bound per unit. The bound is derived backwards from an estimate of how much business one party generates over a lifetime. That estimate does not stand without a track record. A bound placed before any record is an assumption put into the form of a figure. Once it takes that form, its having been an assumption stops being visible even to you.
📖 Contents
- The CPA Formula Is Plain, and Its Plainness Hides the Choice
- The Definition of One Changes with the Stage You Measure
- Once What Is Measured Becomes the Target, It Stops Being What Measures
- What Gets Maximised When You Measure at the Registration Stage
- Why Measuring Downstream Becomes Hard to Do
- The Cost Side Has a Stage Problem Too
- What The Place Breaks Concretely Refers To
- Separate the Figure for Judgement from the Figure for Watching
- A Skew in Composition Needs Looking At Only Once a Quarter
The CPA Formula Is Plain, and Its Plainness Hides the Choice
The cost of acquiring a customer is the spending required to obtain one unit of result. The formula is plain, and because it is plain, the choice made outside the formula stops being visible.
Divide the spending by the count of results obtained. A hundred thousand yen producing ten results gives ten thousand per unit. There is no room for interpretation here.
A procedure is given for setting the target value too. Derive the upper bound of profit obtainable from one unit and subtract the profit you want to secure. What remains is the upper bound of spending permissible per unit.
The improvement methods offered run as follows. Lower the unit cost of impressions and referrals. Adjust the targeting so the proportion reaching a result rises. Revise the landing page so the proportion reaching a result rises.
Each either shrinks the numerator or grows the denominator. Since the formula is a fraction, there are only two directions for improvement. As an indicator of return on spending, this calculation works correctly.
The choice outside the formula is the definition of a result. Every procedure on offer takes result as given. The definition has already been settled as a measurement setting, and the definition itself is not an object of judgement.
Where the shape of the business is fixed and what counts as a result is self-evident, that premise causes no trouble. In formats where a transaction completes in one go, a result cannot be anything other than a purchase.
It becomes a problem when the definition of a result is still open and the choice was made for the convenience of measurement. The most measurable stage becomes the definition of a result. A definition settled by measurability then settles the entire direction of optimisation that follows.
What cannot be measured cannot be managed, so choosing the measurable stage is simply practical — that line holds. Being unable to manage and declining to choose are different things. You can use a measurable stage for judgement while remaining aware of what that stage stands in for. With that awareness, you notice when the proxy breaks.
Without it, the proxy becomes identical with the thing itself. The count of registrations becomes the result, and what registration stood in for is forgotten. Once forgotten, a broken proxy goes undetected.
The procedure for setting a target value carries the same property. The bound cannot be derived without estimating lifetime business, so without a record the estimate is placed as an assumption. A target derived from an assumption inherits the precision of the assumption. And because the target is presented as a figure, its having been an assumption stops being visible.
The Definition of One Changes with the Stage You Measure
Between spending and a continuing transaction lie several stages. Cut into four, the property of the order becomes visible.
The first stage is arrival at your announcement. Measured here, the cost per unit is smallest.
The second stage is a route being established. Contact details have been handed over and a state of continuous delivery exists. In many businesses this is the stage set as the result.
The third stage is the first transaction closing. Only here does money appear.
The fourth stage is the transaction continuing. A second and third occur, and it holds as a relationship.
Divide the same spending by four denominators and four figures appear. The higher the stage the larger the denominator, so the figure is smaller. The lower the stage the smaller the denominator, so the figure is larger.
Here lies the property of the order. The higher the stage, the easier to measure. Arrival and route establishment are recorded on the spot. The lower the stage, the harder to measure. Whether a transaction continues cannot be known for months.
Measurability and weight of meaning run in opposite order.
Measure all four and no single choice is needed — that is a thinkable position. Measuring them all is entirely possible. But the figure used for judgement narrows to one. When deciding whether to stop advertising or raise the budget, the figure used as grounds is one.
And the figure used as grounds becomes the object of optimisation. Measure four and, if judgement runs on the second stage, what gets optimised is the second stage.
Cutting the stages into four is not the only division. The number of stages changes with the shape of the transaction. What does not change is the order: easier to measure above, heavier in meaning below.
The reason this order arises sits on the side of time. The higher the stage, the closer it is in time to your operation. What happens immediately after spending has a plain relation to that spending. The lower stages are further apart in time, so other factors enter between.
And what is heavy in meaning is what survived after those other factors entered. Surviving carries meaning because much does not survive. Durability and measurability cannot, in principle, coexist.
Line up the four figures and the upper one looks best. The denominator is largest, so the cost per unit comes out smallest. A figure that looks good also gets chosen for showing outward. In scenes where results are presented and judgements explained, the upper figure gets used. As it is used, that figure becomes the representative value for the state of the business.
Once What Is Measured Becomes the Target, It Stops Being What Measures
This structure has a well-known formulation. And the form commonly quoted is not the same as the original claim.
In 1975 the economist Charles Goodhart, writing on British monetary policy, stated that any observed statistical regularity will tend to collapse once pressure is placed upon it for control purposes (Goodhart, 1975). Even where a stable relation is observed between the money supply and economic activity, using that relation as an instrument of policy alters the relation itself.
The commonly quoted line — that once a measure becomes a target it ceases to be a good measure — is not Goodhart’s own. It is the generalisation the anthropologist Marilyn Strathern gave to the observation in a 1997 paper on British university assessment (Strathern, 1997, European Review, 5(3), 305–321). The original claim was a limited observation about monetary statistics; the generalisation came afterwards.
The reason for confirming this history is that the range of application differs. What the original claim states is that a variable used for control loses its former relation through the behavioural change of those being controlled. Narrower than becomes a bad measure, and with the mechanism made explicit.
Applied to the cost of acquiring a customer, it runs like this. Place the cost per registration as a target and the character of the act of registering changes. To hit the target, the barrier to registration gets lowered.
Registration after the lowering is not the same thing as registration before it. It is counted as the same one, but what that one meant has changed. This is the very form of the original claim: the relation has altered.
Holding a target is not itself an error. Without a target, spending cannot be judged. The problem is assuming that an indicator placed as a target retains the meaning it had before being placed there.
If it cannot escape changing character, then any indicator is the same and there is no way out. There is no way out. An indicator placed as a target comes under pressure to change character the moment it is used for control. This is unavoidable.
What is avoidable is failing to notice the change. The speed and direction of the change differ by indicator. The more operable the indicator, the faster it changes; the less operable, the slower.
So what should be chosen is not an indicator that does not change but one that changes slowly and whose change appears somewhere else. The count of registrations is the most operable and changes fastest.
Because the generalised line circulates more widely, this law often gets used as a warning to distrust indicators. The original claim is not a warning but a description of a mechanism. Read as a mechanism, it lets you estimate how fast a given indicator will change character. Read as a warning, the work of choosing indicators is abandoned altogether.
What Gets Maximised When You Measure at the Registration Stage
Follow concretely what happens when the second stage — route establishment — is placed as the target. What works best is lowering the barrier to registration.
There are several ways to lower it. Reduce the input fields. Shorten the text that asks for a judgement. Make what is handed over in exchange concrete and easy to grasp. All of them raise the count.
And once lowered fully, registration stops being an act of deciding whether to read. It becomes an act of receiving what is handed over. Since it completes at the moment of receipt, what arrives afterwards was never part of the judgement.
As registrations without involvement accumulate, the row count grows while the thing fails to function as a route. This point is handled in the premises of list building.
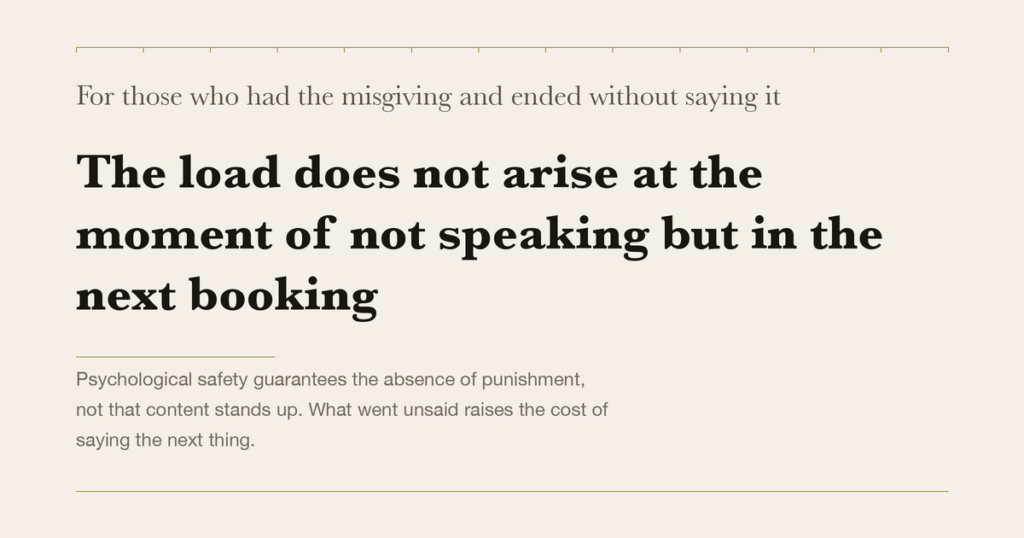
This degradation does not appear in the cost of acquiring a customer. What appears are the downstream figures. The proportion reaching a transaction falls, and the proportion continuing falls.
If the downstream figures fell, surely you notice there. You do. The problem is what gets nominated as the cause once you notice. When downstream figures fall, an inference forms that the cause lies downstream. If the proportion reaching a transaction fell, review the way you propose. If the proportion continuing fell, review the content.
The hypothesis that the cause is the upstream way of measuring does not come out easily. The upstream figures are improving. An inference that the improving place is the cause looks out of order.
When an improving figure and a worsening figure coexist, accounts diverge. Even doing everything yourself, the same thing happens when the periods differ, because the period in which you improved upstream and the period in which downstream worsened sit months apart.
With a gap, the two events are remembered as separate problems. Acquisition improved in spring and response fell in summer do not connect, being far apart. Connecting them requires laying both out along a timeline.
Lowering barriers is not always an error either. Some barriers confirm nothing at all. The number of input fields, the complexity of the procedure, the slowness of the display. Lowering these does not change the level of involvement.
What must not be lowered are the barriers that involve a judgement. Text that must be read and decided upon before registering, an explicit statement of who the audience is, a record of what is not covered. These select who passes through.
Both go by the same word, barrier. And the operation of lowering them feels the same. They can be told apart only by asking what that barrier was confirming.
Why Measuring Downstream Becomes Hard to Do
So measure downstream, then. You can, but two obstacles stand in the way.
The first obstacle is the time lag. Fixing whether it continued takes months, sometimes a year. Throughout that period there is no figure available for judgement.
Judgement does not wait. Whether to continue or stop advertising has to be decided this week. An unfixed figure cannot decide it. Since it cannot, the fixed upstream figure gets used.
The second obstacle is attribution. A number of other factors sit between the spending and the continuing state. The content you published in between, contact from elsewhere, changes in the other party’s situation. Whether the reason for continuing lies in the original spending is not clear.
Upstream this problem is small. Spend, have someone arrive, and have them register on the spot, and the causal chain is short and attribution is plain. The further downstream, the more factors intervene and the vaguer attribution becomes. The plainness of attribution, too, runs opposite to the weight of meaning.
Measuring downstream is not itself impossible. Accept the lag and acknowledge the vagueness of attribution, and it can be done. What is needed is a division of roles: upstream figures for judgement, downstream figures for verification.
For that division to hold, a process for actually looking at the downstream figures is required. Without it, the operation closes on upstream figures alone. A closed operation goes unquestioned as long as the upstream figures keep improving.
With the lag, by the time you see the downstream figure it is already too late. For that round of spending, that is correct. What can be recovered is only the judgements that follow.
Being too late, however, is no reason not to look. Without looking, the next judgement runs on the same settings. Looking, you can change the settings from the next round. One round’s delay remains, but you do not enter a cycle.
On attribution, abandoning strictness is the more practical course. Assigning correctly which spending produced which result takes considerable effort and still does not settle.
What can be used instead is comparison with the period aligned. Treat the group that entered in a given month as a unit and look at where that group stands six months later. Individual attribution stays unknown, but the group’s trajectory can be read. Where settings differ by group, the difference in settings appears as a difference in trajectory.
This comparison gains a property precisely by giving up individual attribution. At group level, the intervening factors are averaged within the group. Why any particular party continued stays unknown, but is this month’s group continuing more than last month’s has an answer.
The Cost Side Has a Stage Problem Too
What counts as spending is not self-evident either.
Money paid for advertising is plainly spending. What about the time spent making that advertisement? The time spent building the page it led to? The time spent writing what gets delivered to those who registered?
Time, in most cases, is not counted as spending. No payment occurs. What is not counted does not enter the calculation.
Then this follows. A method that uses much time and pays little becomes advantageous at the level of the indicator. Write it yourself, build it yourself, deliver it yourself. Payment approaches zero and the cost per unit becomes small.
The figure is calculated correctly. But what is not measured is large. However much the unmeasured part swells, the indicator stays improved.
This structure has the same shape as the upper bound held by formats that sell time. It is treated in detail in why raising your hourly rate does not bring freedom.
Putting a monetary value on your own time is arbitrary — that objection holds. But there is no need to put a monetary value on it. Count it as time, as it is. How many hours did one registration take? That figure carries meaning without being set beside money.
That it cannot be set beside money is in fact the important part. Convert to money and time and money look interchangeable. Looking interchangeable, a judgement to add time and cut money always looks correct. Counted separately, both trajectories stay visible.
Counting time itself takes time. Strict records are not required. Writing down the rough allocation once a month is enough to read the trajectory.
With time outside the costs, a judgement to reduce outside payments always looks correct, because doing it yourself brings payment to zero. And these judgements accumulate. Bring things in-house one by one and payment keeps falling while the indicator keeps improving.
Improvement stops when time runs out. The state of having run out of time does not appear in the indicator. What appears is the form of no longer being able to start anything new. Being unable to start is not an item recorded as a figure.
Separately from whether it is counted, time carries a property that cannot be exchanged. Payments can be raised or lowered; the total volume of time cannot be changed. Put a fixed-total resource into the same formula as a variable one and the judgement of allocation is distorted.
What The Place Breaks Concretely Refers To
What the phrase points to is a cycle in which a skewed composition invites further skew.
Keep optimising the upstream indicator and the composition of those gathering changes. The change has a direction. The proportion of parties paying involvement falls, and the proportion paying none rises. Lowering the barrier lets through only the parties without involvement; those with involvement were passing through even with the barrier.
When composition changes, response to what you publish changes. The average response falls, so adjustment toward the average begins. Make it clearer, shorter, lighter.
That adjustment leaves parties with involvement unsatisfied. When the unsatisfying state continues, those parties leave quietly. They are never recorded as departures; they simply stop opening.
The composition then skews further. Adjustment is performed again for the skewed composition. No force from outside acts to stop this cycle. Each stage’s judgement is correctly made on observed response.
Nothing breaks at a particular moment. What the word points to is entering this state of self-reinforcement.
Composition changing is not always bad in itself. Done deliberately as a judgement to widen the audience, it is design. The problem is when it occurs unintended, as a by-product of optimising an indicator.
While in this cycle, the figures look good. Registrations rise, cost per unit falls, and the absolute count of responses sometimes rises too. What is worsening is composition, and composition is not aggregated as a figure.
If parties with high involvement left, the absolute count of responses should fall too — that inference forms. Sometimes it does not fall. Parties with high involvement were a minority to begin with. A minority leaving while a majority is added raises the absolute count. The average falls, but a falling average can be explained as the result of a growing base.
That an explanation is available is what makes this phenomenon hard to see. Changes in figures always admit several explanations. A skew in composition is the least verifiable of them.
Not every business depends on parties with high involvement. In formats where a transaction completes in one go, a skew in composition is not directly a loss. The skew becomes a problem in designs premised on transactions continuing.
And in designs premised on continuation, a high-involvement minority often carries the bulk of the business. In that case, the departure of the minority appears not in the absolute count but in the revenue. Since it appears elsewhere, the inference about the cause heads in another direction too.
Separate the Figure for Judgement from the Figure for Watching
Given that the figure used for judgement narrows to one, how is that one chosen? The criterion is whether that stage is recoverable.
Measure upstream and judgement is fast, but optimisation proceeds in the wrong direction. Optimisation that has proceeded can be reversed afterwards. Lower the barrier too far and you can raise it back. Reversing takes time, but as an operation it is possible.
What cannot be reversed is a skew in composition that has entered the cycle. Parties who left do not return. And their leaving was never recorded.
So the combination becomes: judge on upstream figures, and watch the downstream figures for whether the cycle has been entered. Watching need not be as frequent as judging. Once a quarter suffices if the trajectory of composition can be read.
One principle is required here. The indicator placed as a target and the indicator used for watching must be different.
Use the same indicator for both and the watching stops working. An indicator being optimised as a target is being operated to improve. You cannot look at an improving indicator and judge that things are sound.
The condition for an indicator used for watching is that you cannot operate it directly. What can be operated loses its role as a watch the moment it becomes a target.
An indicator you cannot operate directly moves slowly and is hard to interpret. That it is awkward to use for watching is a fact. The awkwardness comes from the same property as the resistance to being operated. A convenient watching indicator does not, in principle, exist.
The same thing happens to a watching indicator. Begin operating it to make it better and it too changes character. There is no way to prevent this on the side of the indicator.
Prevention runs through separating the roles explicitly. This figure is for judgement; this figure is for verdicts only. For a figure designated verdicts-only, take no measure that moves it directly.
This discipline cannot be verified from outside. It is the kind you settle yourself and keep yourself. Whether it is being kept shows in where you placed your hand when that figure worsened. Put your hand on the watching indicator itself and the discipline has already collapsed.
The criterion of recoverability applies not only to the choice of indicator but to the choice of measures. Try reversible operations first and leave irreversible ones for last. Operations that change composition mostly fall on the irreversible side.
Reverse the order and the shape of the cost changes too. Trying reversible operations first, a miss costs only time. Trying irreversible ones first, a miss remains as a loss of composition — and the size of that loss cannot be measured. A loss that cannot be measured does not become material for the next judgement either.
A Skew in Composition Needs Looking At Only Once a Quarter
What the watching uses is not the cost per unit itself. It is the composition of those who entered. And it cannot be read monthly.
The first indicator is whether the trajectories of the four stages point the same way. If upstream improves and downstream is flat, the increase is not reaching downstream. If upstream improves and downstream worsens, the cycle has been entered. Watching one figure, this relation is invisible.
The second indicator is the interval from registration to first transaction. If the interval lengthens, the proportion of low-involvement parties has risen. Parties who entered with involvement take less time to judge. The interval is recorded automatically, so aggregating it is easy.
The third indicator is the distribution of responses to what you publish. Look at the distribution, not the average. If it splits into a strongly responding minority and a wholly unresponsive majority, the composition has already skewed. Watching the average alone crushes this split into one figure.
All three look at the composition of those who entered rather than the efficiency of spending. Since the choice of measured stage settles composition, what needs confirming is the side of composition.
The reason cost per unit sits outside the main indicators is the same. This figure falls the same way under two different events. It falls when delivery to the audience improves, and it falls when the barrier is lowered and low-involvement parties are let through. The latter worsens downstream, and that worsening appears only months later.
None of the three indicators can be read in a single month. They carry meaning only laid out as a trajectory. So this confirmation is quarterly or half-yearly work rather than monthly.
Low frequency also means easily forgotten. Figures seen monthly become habit; a quarterly confirmation goes unperformed unless it is put in the schedule. Putting it in the schedule is itself the substance of this watching.
Of the three, the second — the interval from registration to first transaction — is the easiest to automate. The records already exist, so aggregating produces it. If you are starting, this offers the least resistance.
The question of whether those who entered go on to continue is handled in what moves the repeat rate is the design of the relationship, not the measures.
If you place an upper bound, you have to write, in the same place, that the figure is an assumption. The bound is derived backwards from an estimate of lifetime business, and that estimate does not stand without a record. For the period before a record exists, no value can be placed.
Two thousand, ten thousand and roughly thirty-three thousand. These three figures are all correct, and all measure different things. That measurability and weight of meaning run in opposite order, and that only the one chosen for judgement gets optimised — the difference between the three figures folds into those two.
In the end, what has to be decided narrows to two. Which of the upstream figures to use for judgement. And, separately, whether to set aside one figure you do not move directly, for watching. Where the second has not been decided, the role of watching has not been assigned to any figure.