Some people stop while satisfied. Some people carry on for years while complaining.
Neither is unusual. And yet many accounts of the retention rate fail to explain either of them. The account is shaped as above a threshold of satisfaction they carry on, below it they stop. Observations that will not fit inside the frame get processed as exceptions. What is processed as an exception never becomes material for the next proposal.
What separates the two is not necessarily the substance itself. It is whether an understanding of what that substance is for is shared on the other person’s side. Where the understanding is shared, the relationship survives an occasion that falls short. Where it is not, even a good occasion ends at that one was good and connects to nothing. Satisfaction taken one occasion at a time does not accumulate, because there is no frame on the other side to accumulate into.
Let me write out first what this article settles. Three things. What the retention figure is actually counting. What produces continuation independently of satisfaction, and why the figure cannot separate the two. And how to split out how much of your current number is being held by friction.
What it does not answer belongs here too. What retention percentage is healthy for your business is a question this article holds no answer to. The interval of delivery and the unit of contract change what the same number means. Nor does it supply a catalogue of measures for raising retention. Catalogues circulate widely enough already, and adding one item leaves you exactly as unable to say what any rise is made of.
Where the damage lands is clear. It is the state in which, when the figure rises, you cannot split what the rise is made of. Keep operating without that verdict and the design drifts quietly toward whichever side costs less. It drifts even where nobody remembers choosing.
The period without a verdict is also the period in which design freedom is lost. Friction can be added and, once removed, takes the figure down with it. An operation that lowers the figure looks like a loss whenever it is carried out.
Next door sit two articles counting the same phenomenon in a different unit. Whether the same person buys a second time, where no contract is involved, sits in what the repeat rate observes is the state of the relationship still running; the catalogue of available moves, and what remains once you have worked through all of it, sits in where repeat measures return to after running their course.
📖 Contents
- What Is Currently Shared About the Retention Rate
- What Is Counted Is “Has Not Stopped”, Not “Is Carrying On”
- What Settles Continuation Apart from Satisfaction — the Cost of Switching
- What Carrying On Actually Consists Of — a Shared Framing
- A Shared Framing Cannot Be Distributed from Your Side
- Why Raising the Quality of the Substance Sometimes Moves Nothing
- Why an Average Retention Rate or a Projection Table Cannot Judge Your Own Figure
- Why the Onboarding Process Works, and It Is Not Because Operations Are Learned
- How to Split Out How Much of the Current Figure Friction Is Holding
What Is Currently Shared About the Retention Rate
The causes of decline and the remedies are presented as a pair, and the pair treats continuation as accumulated satisfaction.
The retention rate is the proportion of customers present at the start of a period who are still present at the end, also called the retention ratio or the customer-keeping rate. The formula is the count of continuing customers at the end divided by the count at the start, times one hundred.
In monthly formats, membership formats and formats built around continued use, it is treated as one of the most important indicators. The comparison that keeping costs less than acquiring is added as the reason for the weight it carries.
The causes of decline presented run roughly as follows. The quality of the product or service does not meet expectations. Support is thin. People are left without knowing how to use it. A gap between expectation and reality is given as the main driver of departure.
The remedies are the causes turned around. First, fuller support: faster responses to enquiries, more channels, a maintained set of common questions. Second, higher quality: improve what is delivered. Third, an onboarding process: guide people at the outset until they can use the thing correctly. Stumble here, the account adds, and use does not continue afterwards.
None of the three is wrong as advice from the field. Slow responses do lose people, and something nobody knows how to use goes unused. That an onboarding process helps retention is observed across many domains.
Beneath the three sits a shared premise. All of them treat continuation as accumulated satisfaction. Satisfaction past some level means carrying on; short of it means stopping. Operating on that level is therefore the remedy for retention.
That satisfaction being low leads to stopping matches the facts. What is off is that the converse does not follow. Satisfaction being high does not mean they carry on. Those who stop while satisfied and those who stay while complaining are the counter-examples.
Why counter-examples get processed as exceptions also follows from the framing. The framing explains in one direction only, so there is nowhere to put an observation running the other way. Observations with nowhere to go vanish unrecorded. What has vanished gets treated as a fresh case the next time it appears.
The framing has a consequence on the prescription side too. Read continuation as accumulated satisfaction and the prescription is fixed in the single direction of make it better. Directions in which to make things better are unlimited, so the prescription has no end. Having no end, it also yields no verdict on whether it is working.
What Is Counted Is “Has Not Stopped”, Not “Is Carrying On”
What this figure counts is not an action but the absence of one.
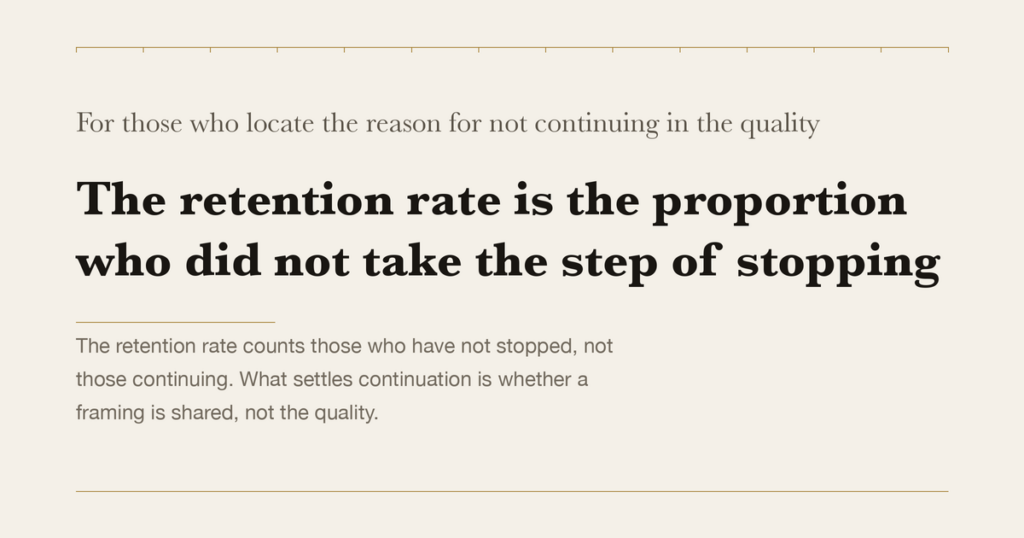
Restated: the retention rate is the proportion of people who, at the end of the period, did not take the step of stopping.
Not taking the step of stopping and carrying on are not the same. The first includes the state of having done nothing; the second does not. On the figure, the two are not separated. Somebody using it intently and somebody who has forgotten it exists are both booked as continuing. On the single point of not having performed the stopping action, they land on the same side.
On the operating side, one consequence follows. Increasing non-action is easier than increasing action. You make the stopping action troublesome. Obscure the cancellation path, take it only by telephone, default to annual terms. These tend to raise the retention rate.
The sense that you are running no such design is, in most cases, accurate. Difficulty of stopping arises even where nobody designed it. The location of the procedure is unclear, it is awkward to raise with the person handling the account, quitting part-way looks like a loss. With no memory of designing it, the effect is the same.
Nor is the point that making it easy to stop produces a good number. Make it easy and the number falls. What can be said is that this indicator alone cannot split how much of the current figure is carrying on and how much is has not stopped.
Without the split, measurement of effect is void. When the figure rises, you cannot tell whether the relationship thickened or stopping got harder. Unable to tell, you also cannot tell which direction you are moving in.
The effect of the missing split grows with time. Friction, once built, stays, so its share of the figure grows period by period. The relationship side has to be rebuilt each time, so it grows slowly. Watch the same figure for years and the breakdown quietly swaps over.
The two directions cost entirely different amounts. The friction side takes one configuration change and no ongoing effort. The relationship side takes effort at every delivery, indefinitely.
The cost difference works as pressure on choice. Where the same figure comes at the same price, the cheaper is chosen. With no memory of choosing, the same choice repeats in the form of what gets postponed in a busy month. And what tends to get postponed is the effortful side.
What Settles Continuation Apart from Satisfaction — the Cost of Switching
One reason satisfaction and retention do not line up is that a third variable sits between them: the cost of switching.
Thomas Burnham, Judy Frels and Vijay Mahajan set out, in 2003, three types of cost a consumer bears in moving to another provider (Burnham, Frels & Mahajan, 2003, Journal of the Academy of Marketing Science, 31(2), 109–126). Procedural costs — the work of investigating again, configuring again, learning again. Financial costs — what has already been paid, and the benefits forfeited. And relational costs, meaning the severing of ties to a person or a place.
What their analysis showed is that these costs explain the intention to continue separately from satisfaction. Satisfied people move easily where switching is cheap, and unsatisfied people stay where it is expensive. Those who stop while satisfied and those who stay while complaining are settled on this one point.
The study surveyed consumers in particular markets, so the size of the effect cannot be carried across as it stands. The weighting among the three types also differs with what is being handled. What transfers is the structure, not the magnitude. The retention figure is not a function of satisfaction; it is satisfaction and cost combined.
Once it is understood as a combination, the reading of the figure shifts. From the fact of a high retention rate, either account can be drawn. Is satisfaction high, or is cost high? This number alone does not decide.
And the three costs do not deserve the same treatment. Procedural and financial costs can be raised or lowered by your design. Relational cost does not rise because you set out to raise it. There are two you can raise easily and one you cannot. Either kind moves the figure the same way, so the hand reaches for the easy side.
The pull toward the easy side also has a records-based reason. Procedural and financial costs remain as values you configured. Relational cost is recorded nowhere as a number. Operate on the recorded side alone and a variable moves that you had no intention of moving.
One qualification. Nothing here says switching costs should be zero. Accumulated settings and history are themselves of value to the other person. The line runs through whether the cost has left anything on their side. Accumulated history has. A single cancellation channel has left nothing.
What Carrying On Actually Consists Of — a Shared Framing
Actually carrying on means the other person holds, in words, a reason for continuing.
Being able to state a reason means what you deliver is connected to something of theirs. What it connects to is mostly a purpose on their side. This person knows what they are trying to do and where this sits within it. That state is what a shared framing means.
Where it is not shared, this is how it shows. Impressions of the content can be stated; why they continue cannot. It has been useful, it is good reference material are impressions, not positions.
Research on motivation has shown repeatedly that behaviour driven by a reason given from outside and behaviour driven by a reason integrated with one’s own purpose persist differently. The self-determination theory that Deci and Ryan systematised arranges the difference as a continuum from external regulation to integrated regulation (Deci & Ryan, 1985; Ryan & Deci, 2000, American Psychologist, 55(1), 68–78). A shared framing corresponds, on that continuum, to the move from external regulation to identified regulation. The location of the reason shifts from because I was told to keep going to because my own purpose needs it.
Whether the shift occurs is settled independently of the quality of the content. Quality can be high and, without connection to their purpose, no shift occurs. Quality can be moderate and, with connection, it does.
None of this makes quality unnecessary. After connection, the relationship ends if the content does not hold up. Quality is a necessary condition, not a sufficient one.
To the worry that reaching into somebody’s purpose goes too far, the answer is that you never reach in. The connection is made by them, not you. What you can do stops at placing things in a connectable form.
Concretely, that means being clear about what your offer makes possible and what it does not. Something with vague boundaries cannot be positioned on their side. What cannot be positioned is received only as an impression of better or worse.
Making the boundaries clear reveals first the people who fall outside them. Learning that looks like a loss, and those outside would only have stopped later. Stopping later spends both parties’ time for the length of the delay.
A Shared Framing Cannot Be Distributed from Your Side
The move that comes first once framing is understood to matter tends not to work. Declare a set of principles, describe a worldview, keep publishing why you do this. All are necessary work, and none of it produces sharing on its own.
The reason lies inside the word shared. Shared does not mean both parties hold the same words. It means their purpose and what you deliver are connected inside their head. The connection is made not by your words but by their own work of positioning it in their own language.
What distribution produces is your words placed in their memory, and no further. Placed words that are not connected to their purpose remain as sentences available for quotation.
There is a way to tell. While somebody is using your phrasing verbatim, the connection has not yet occurred. When they explain in the language of their own situation, it has. “I see now that it is a structural problem” is the first. “I noticed that the way I take work is itself a form of selling time” is the second.
Using the phrasing verbatim is evidence of understanding. Understanding and connection are separate, though. Understanding is a state concerning the content; connection is a state concerning one’s own purpose. Understanding the content precisely while connecting none of it to one’s own situation happens.
Nor is distribution wasted. Without material, no connection occurs either. What can be said is that the volume distributed and the volume connected are not proportional.
Since they are not proportional, trying to solve it by distributing more only increases volume. Frequency rises, the processing load on the other side rises, and the proportion read falls. That path runs into the structure handled in how to write an email newsletter.
There are occasions when distribution does work. They are occasions where the other person has already put their purpose into words and only the material tying it to your offer is missing. Here the material distributed goes straight into the connection. What separates the working case from the failing one is not volume but whether a frame exists on their side.
As volume rises, something changes on your side too. The work of distributing the next thing starts arriving ahead of the work of confirming that connection occurred. Distribution has deadlines; confirmation does not. Only work with deadlines gets carried out, so confirmation is structurally postponed. Postponement continues, and you arrive at a state where volume has accumulated with no connection underneath — a state that looks, on the figures, extremely active.
Why Raising the Quality of the Substance Sometimes Moves Nothing
Raising quality and sharing a framing are asymmetric in one respect: whether you can observe them.
Raising quality completes on your side. Time reliably raises it, and you can see that it rose. Sharing a framing does not complete on your side. Whether it holds on their side is invisible from here. Holding only on the other side is not peculiar to a shared framing. The view that what is arranged in the stages is a quantity on their side is handled in the funnel as a whole.
The asymmetry biases the direction of improvement. Visible work continues, invisible work is postponed. The more you raise quality, the stronger the conviction in that direction becomes.
And when raising quality moves nothing, the interpretation that arrives is not yet enough. Continuing further in the same direction is the first reading available. Doubting the direction itself arrives later by exactly that margin.
Why later? Because raising quality leaves a record and a framing that failed to be shared leaves none. What you have to hand is only the record of this much was improved.
The expectation that good content will convey its framing on its own holds under one condition: where the other person already has their own purpose, they position your offer themselves. Somebody whose purpose is not yet in words has no frame to position it in. Receive good content without a frame and only the memory of a good experience is left. The memory fades, and connects to nothing when the next need arises.
Being late also carries a cost consequence. Work on quality loads directly onto the following period’s cost of delivery. Without connection, that added cost does not convert into continuation. A period in which the figure is flat while costs rise continues for exactly as long as it takes to doubt the direction.
This is the same structure as the ordering handled in reading “I cannot change” through cognitive science, where recognition arrives after purpose. Without a purpose placed first, what counts as important information is undetermined.
The structure produces, on the delivering side, a classification into good and bad customers. Those with clear purposes carry on; those without stop. The first then get called the committed ones and the second the ones it did not suit. The moment that classification appears, what you could do drops outside the examination.
Connection does not occur with everybody. Where the direction of purpose genuinely differs, no amount of care produces it. What is dangerous is that the classification functions as an explanation. It did not suit them is a description of an outcome, not an account of a cause. A description of an outcome wearing the clothes of an explanation closes the question. A closed question supplies nothing to the next design.
Why an Average Retention Rate or a Projection Table Cannot Judge Your Own Figure
Averages of retention rates, and tables projecting future revenue from a retention rate, are both built on somebody else’s denominator.
Figures circulating as industry averages mix businesses with different contract units, different delivery intervals and different accounting periods. In a monthly format cancellable at any time and an annual format movable only at renewal, the same word retention rate points at different quantities. A mixed average judges neither.
Retention simulations sit in the same place. A table that puts in a few retention rates and computes future customer counts or revenue is arithmetically correct. That the inputs are predictions is not displayed anywhere on the output. The table arrives looking like a revenue listing. Things that look the same appear to carry the same certainty.
For a business a short way in, the problem is sharper still. What can be observed reaches only as far as the business has run. A retention rate set in year one is not measured; it is entirely assumed.
The reply that you cannot decide without assumptions is correct. What is dangerous is that the moment an assumption takes the form of a number, the marker saying it is an assumption disappears. Values on the table come to look identical to measured ones.
Figures at this stage have one further property. A state in which results have not yet arrived and a state in which results will not arrive appear as the same value. Take a measure on that value and you fold away, as a failure, something still in the middle of growing.
Projection tables have another property that is easily missed. Set the retention rate as a single value and the distribution inside the group disappears. An average of eighty per cent holds where everybody stays at about eighty per cent, and holds where nine in ten stop within a year while one in ten stays for years. Behind the same value, the businesses look nothing alike. In the second, what is happening to that one in ten is nearly the whole business, and the average is neither group’s value.
An average does one more thing: it fixes what you compare yourself against. Once your figure sits above the average, the inspection stops there. If what sits above the average is friction, the comparison will not tell you. As long as the comparison points outward, the question of the breakdown never arises.
None of this says to throw averages and projections away. A projection is a useful instrument for seeing what happens when conditions change. What can be said is that the table answers if this rate, then this and stops there. It does not answer this rate will hold. Outside the table, a record of where the rate came from is required.
Without that record, the next person to open the table reads the rate as a measured value. Whoever they are — including yourself six months on — the same thing happens.
Why the Onboarding Process Works, and It Is Not Because Operations Are Learned
Lending a hand until the first use goes through correctly does help retention strongly. The reason it helps differs from the reason usually given.
Because they learn how to use it is half right. Learning how to use it does reduce departure. Somebody who learned only the operations, though, stops the moment their use case changes. They learned the operations and never received why they were doing them.
What the onboarding process actually does is serve as the main occasion on which a framing is handed across. The reason is simple: the outset is when interest on their side is high. Then your explanation tends to be read to the end. Later, the same explanation tends not to be opened.
The process is designed as an explanation of operations while functioning as the handover of a framing.
A practical consequence follows. Optimise the onboarding process as an explanation of operations and its effect falls. Short, clear, no hesitation. Polish in that direction and operations are learned faster while the handover of the framing is cut away.
The worry that a long explanation up front will lose people is well founded. It is not a question of length, though. What has to be handed across is not a volume of explanation but one point: what this person is trying to do and where this sits within it.
That one point tends to stay better when they say it than when you explain it. Asking people, once at the outset, to write down what they started this for works for that reason.
The format makes visible those who cannot answer. A certain proportion cannot write down a purpose. And here the temptation arrives to use the visibility as a screen. Screen on it and you cut away the people who have not yet put a purpose into words. Those are precisely the people whom a shared framing can change greatly.
Nor does asking produce connection by itself. An answer demanded as a formality gets written as a formality. The format works only where what was written is referred back to later. Referring back means, for instance, returning months on with you wrote this at the start; where are you now. At the moment it is returned, those words change from characters in a form to a record of the person’s own judgement. Ask once and leave it there and the process stays an explanation of operations.
How to Split Out How Much of the Current Figure Friction Is Holding
The split is readable not from the proportion continuing but from what happens when you move the conditions on the stopping side.
First, why the split is needed at all. The retention rate rises in two opposite states. In one, a framing is shared and the person continues for their own purpose. In the other, the person can no longer proceed without you. The second appears on the figures as the very best customer: long-running, never departing, easy to raise the price on. And that state deteriorates as the person becomes able to judge for themselves.
With this structure in place, a business that sets the indicator as a target drifts quietly toward designs in which people do not become independent. It happens with nobody holding any bad intent. Designs that foster independence lower the figure and designs that produce dependence raise it. Dependence, moreover, is not detected by satisfaction surveys. People who have handed their judgement over tend to report high satisfaction, because hesitation falls while it is handed over.
Three things are therefore worth watching. One: at renewal, whether they can state their reason for continuing in the language of their own situation. If what comes back is still your own vocabulary, the reason has not crossed over to their side. Two: what happens after an occasion that fell short. Where the framing is shared, that occasion is processed as this one fell outside my interest; where it is not, one miss becomes the verdict on the whole relationship. Three: what happens when you make stopping easy. Announce the renewal date in advance, state the cancellation channel, remove the penalty for mid-term exit. If the figure barely moves, the reason for continuing is on the side of the relationship. If it drops sharply, what held it was friction.
The third meets resistance. It returns nothing beyond finding out, and it may lower the figure. It need not be run across everybody; making the renewal notice explicit for a subset will settle it. Resistance does not disappear even so, and the check tends to be deferred. As long as it is deferred, what the current figure is made of stays unknown.
What percentage is good, over what period to count, when to insert the onboarding process. Nothing here supplies a target percentage. For something arriving every three days and something renewed once a year, the same eighty per cent points at different states.
Some people stop while satisfied, and some carry on while complaining. Those two were not exceptions. Given that the retention figure combines satisfaction with the cost of switching, both occur.
The account that explains continuation by the level of satisfaction was not wrong. What was wrong was the assumption underneath it: that one figure corresponds to one state. Satisfaction and the cost of switching both genuinely produce continuation. Read the figure while the two stay combined and the one thing hidden is which of them a rise was made of. Read it split and the same eighty per cent shows two portions side by side: the portion held by a shared framing, and the portion held by the difficulty of stopping.
Splitting carries a cost. Loosen the conditions on the stopping side and the short-term number falls. An operation that lowers the short-term number looks like a loss whatever moment you pick for it. And while the adjudication is deferred, the friction side keeps accumulating. The more it accumulates, the further the figure falls when the conditions are later loosened. Waiting is not neutral; it is a choice that drifts to one side. When, and across which subset, to loosen the conditions can be decided once that much is in view.